
Being able to track real-time traffic consumption gives you peace of mind and a accurate idea of your overall server usage.
It helps you plan your resource utilization more adequately so as to
prevent any eventual spikes that could disrupt your server’s
performance.
For clients at Thexyz who have a dedicated server, you can now rely on a much-improved, comprehensive daily traffic
data tool that has been integrated into Thexyz Server Control Panel.
To find the tool, go to the Statistics section in your Hepsia Control Panel.
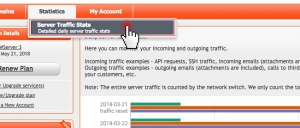
For now, it is only available in the default version of the Control Panel. We’ll soon add it to the beta version as well.
The statistics themselves are presented on a daily basis in an easy-to-read format.
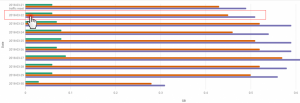
It features a visual chart, which gives you а clear comparative illustration of your incoming/outgoing server traffic.
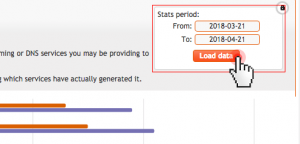
Using the floating menu in the top-right corner, you’ll be able to
select the period for which you want to get traffic usage information:
How to read the server traffic statistics?
The traffic statistics interface will keep you up to date with your bidirectional traffic flow, as follows:
Incoming traffic – this includes all operations that require a connection to your server:
- all types of API requests;
- SSH connections;
- incoming emails with attachments included (if any);
- inbound FTP connections, etc.;
Outgoing traffic – this includes all outbound server connections:
- outgoing emails with attachments included (if any);
- calls to third-party APIs;
- outbound FTP connections;
- any media streaming or DNS services that you may be providing, etc.;
NOTE: The entire server traffic is
counted by the network switch. This means that we only count the total
amount of incoming/outgoing traffic without knowing which services in
particular have generated it.


